HyCloud

HyCloud

Web platform for remote monitoring

HyCloud is the service offered by HYTERM that enables remote monitoring and remote assistance of machines and systems.
Accessible via web, it requires no installation and, thanks to a simple and intuitive user interface, allows data reading comfortably from a PC or mobile device.

Advanced Monitoring

HyCloud allows you to always keep machines or systems installed in the most remote corners of the world under control, avoiding costly on-site interventions.

Secure

The reliability of the HyCloud service is guaranteed by a dedicated VPN and secure communication performed according to standard encryption protocols.

Performance Improvement

Thanks to the collected data, HyCloud enables in-depth knowledge of the operation of machines and systems installed in the field, allowing fine-tuning that improves their efficiency.

Predictive Maintenance

HyCloud analyzes the collected data with the aim of anticipating machine or system downtime through timely and targeted maintenance interventions.

Historical Data

HyCloud displays the historical data of machines and systems in tabular or graphical form based on the collected data.

Customizable

Fully developed in-house, HyCloud is customizable according to customer needs.

Versatile

HyCloud is natively compatible with all HYTERM products, but thanks to its versatility, it can be interfaced with any other device on the market. Its versatility makes it particularly suitable for use on machines and systems already installed in the field.

HyCloud

HyCloud collects data and information from all devices deployed in the field and makes them centrally available, displaying them through complete and intuitive thematic pages.

General

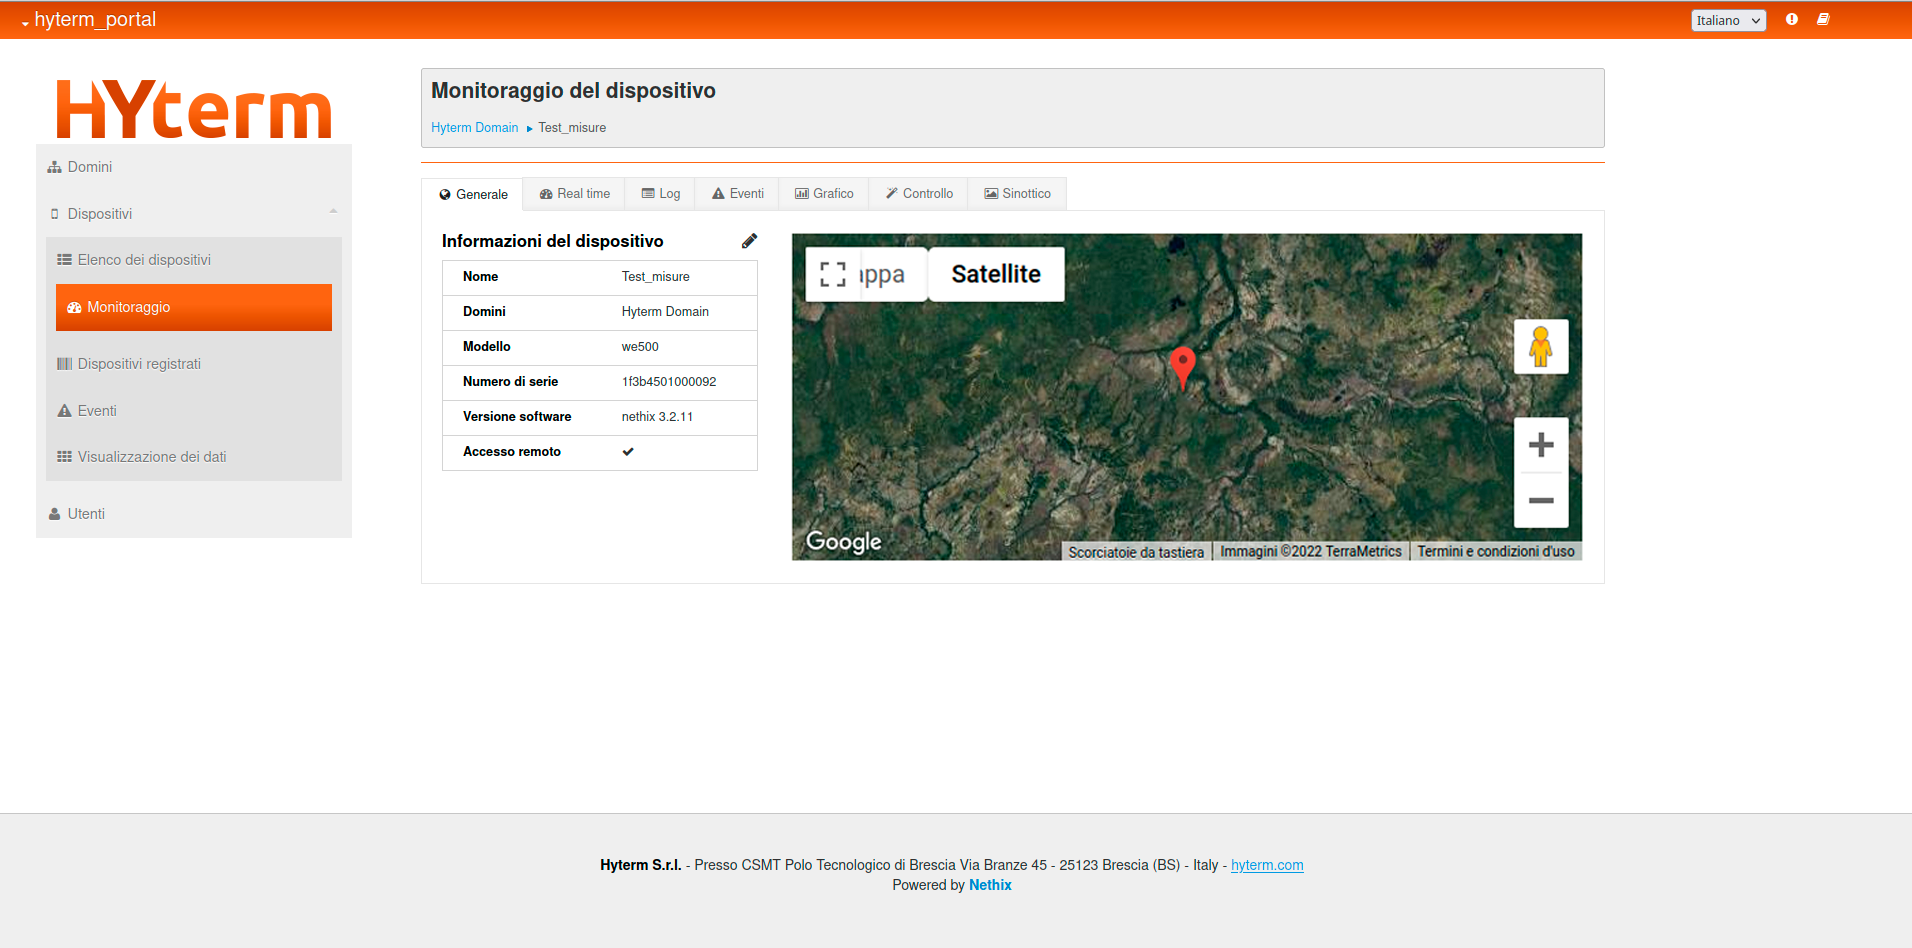
GENERAL presents in a simple and fast way the general data of the system such as name, geographic position, installed gateway model, connection status, etc.

Synoptic

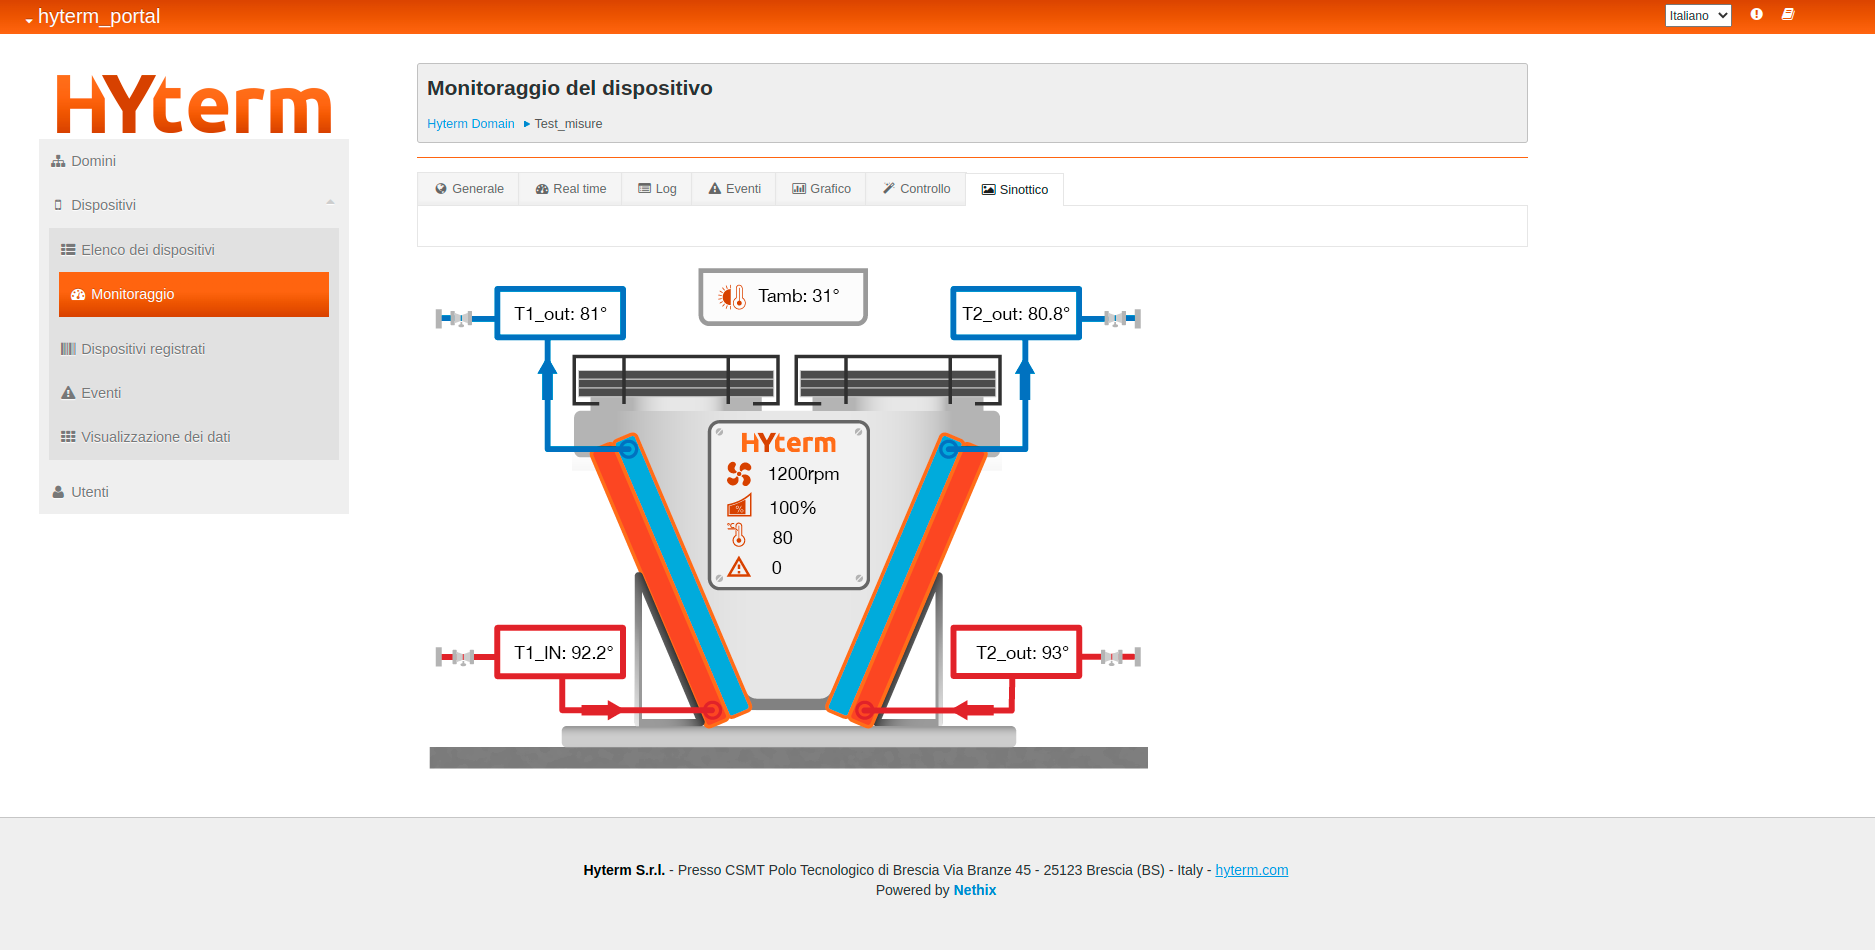
SYNOPTIC provides at a glance the main operating parameters of the machine or system: a simple and intuitive dashboard available to the after-sales service to provide immediate and accurate responses.

Log

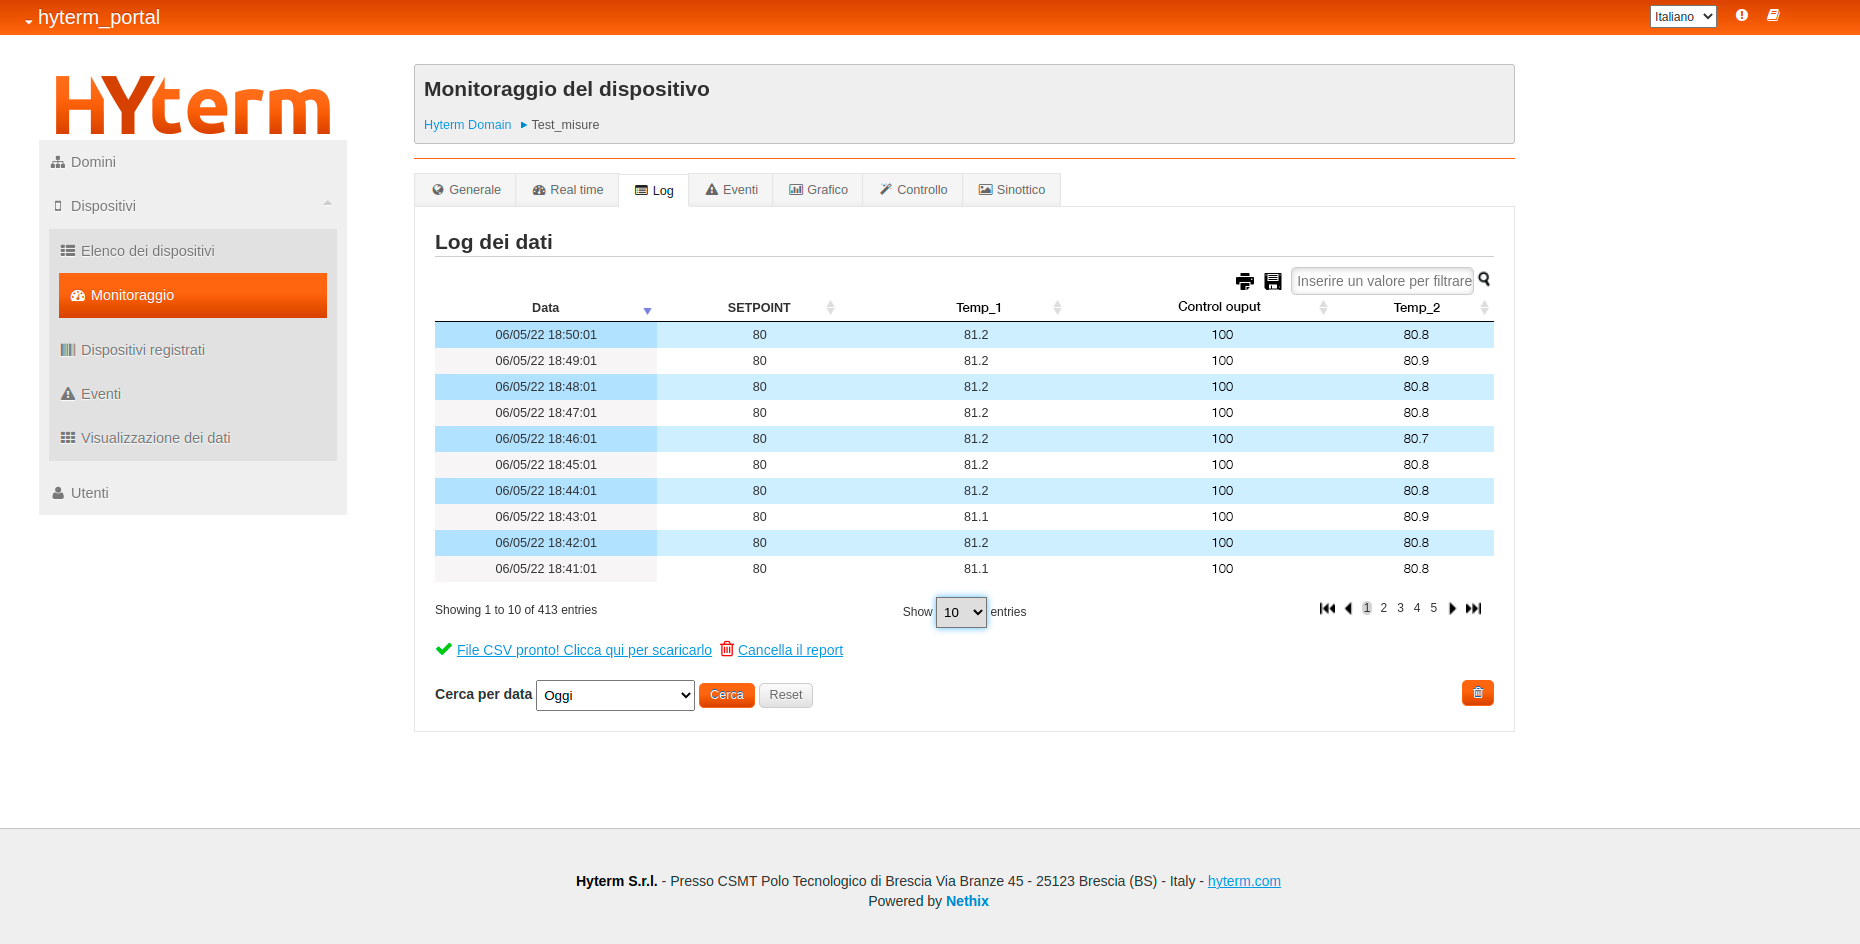
LOG displays data in sortable columns: sampling date and time, variables, operating states, etc., are available for download and subsequent processing.

Graph

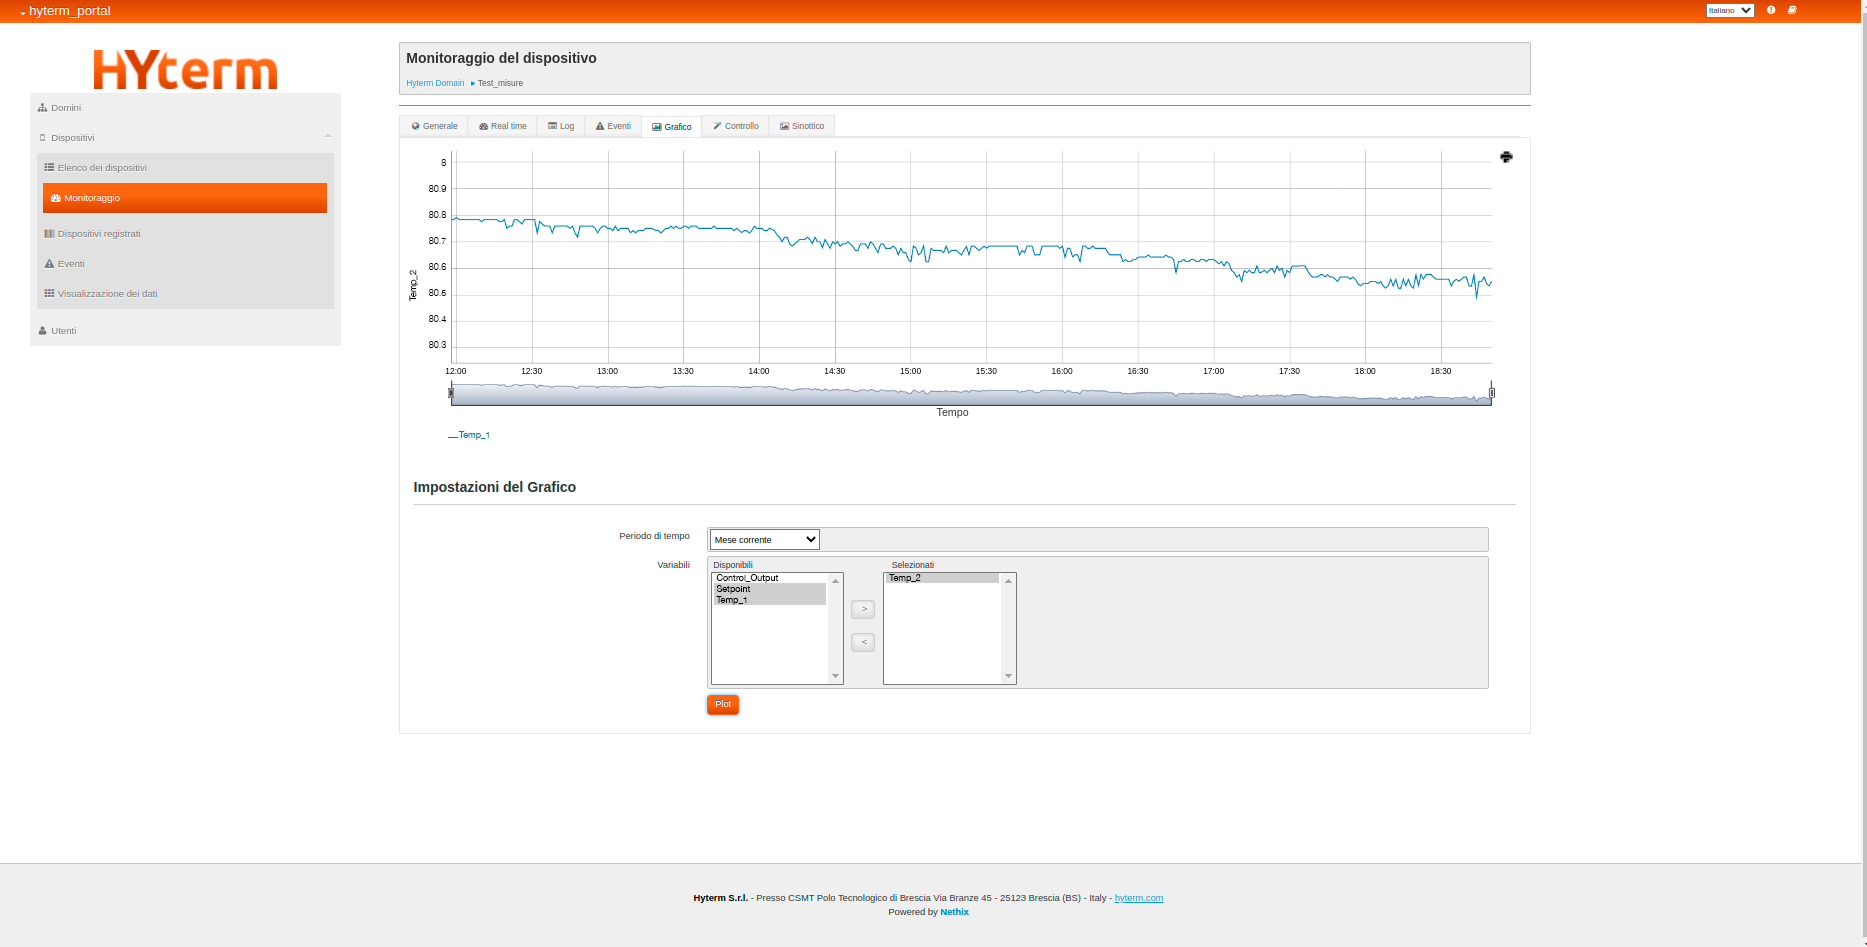
GRAPH allows visualization of variable trends over time directly on the portal. The page allows selection of one or more variables to display and the desired time range, enabling quick and reliable analyses.