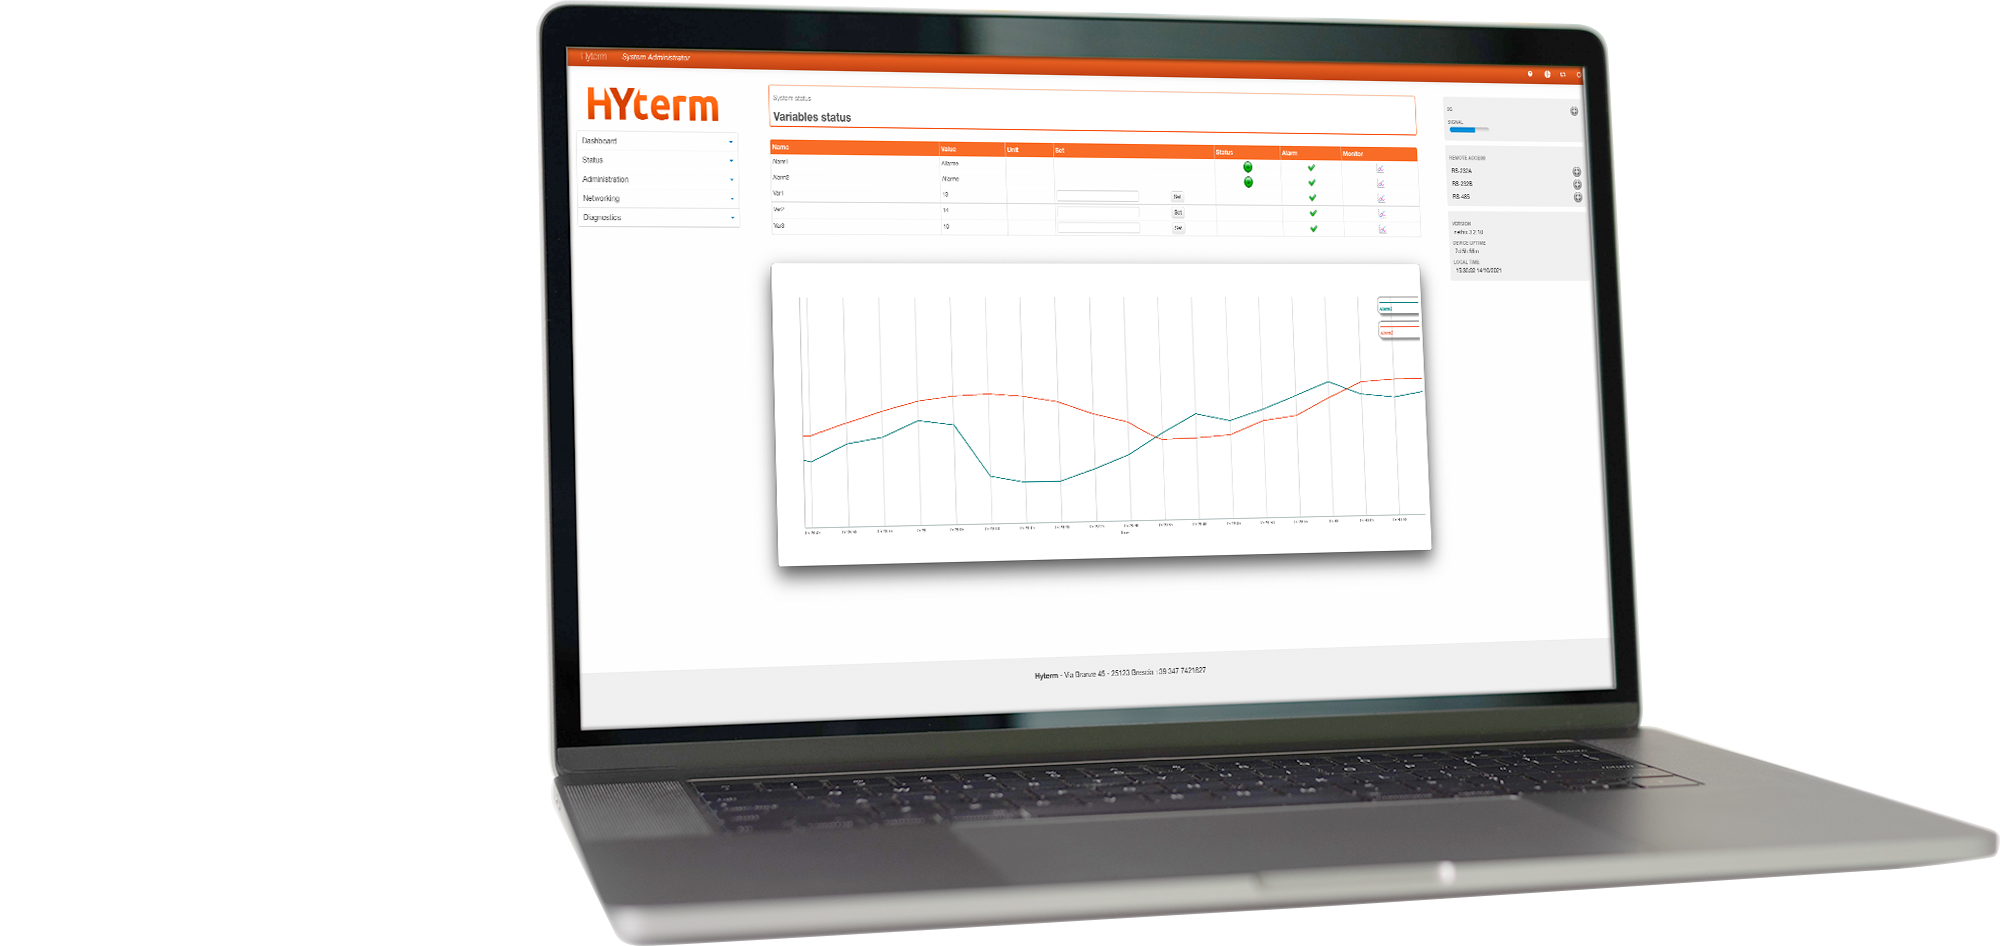
HyCloud

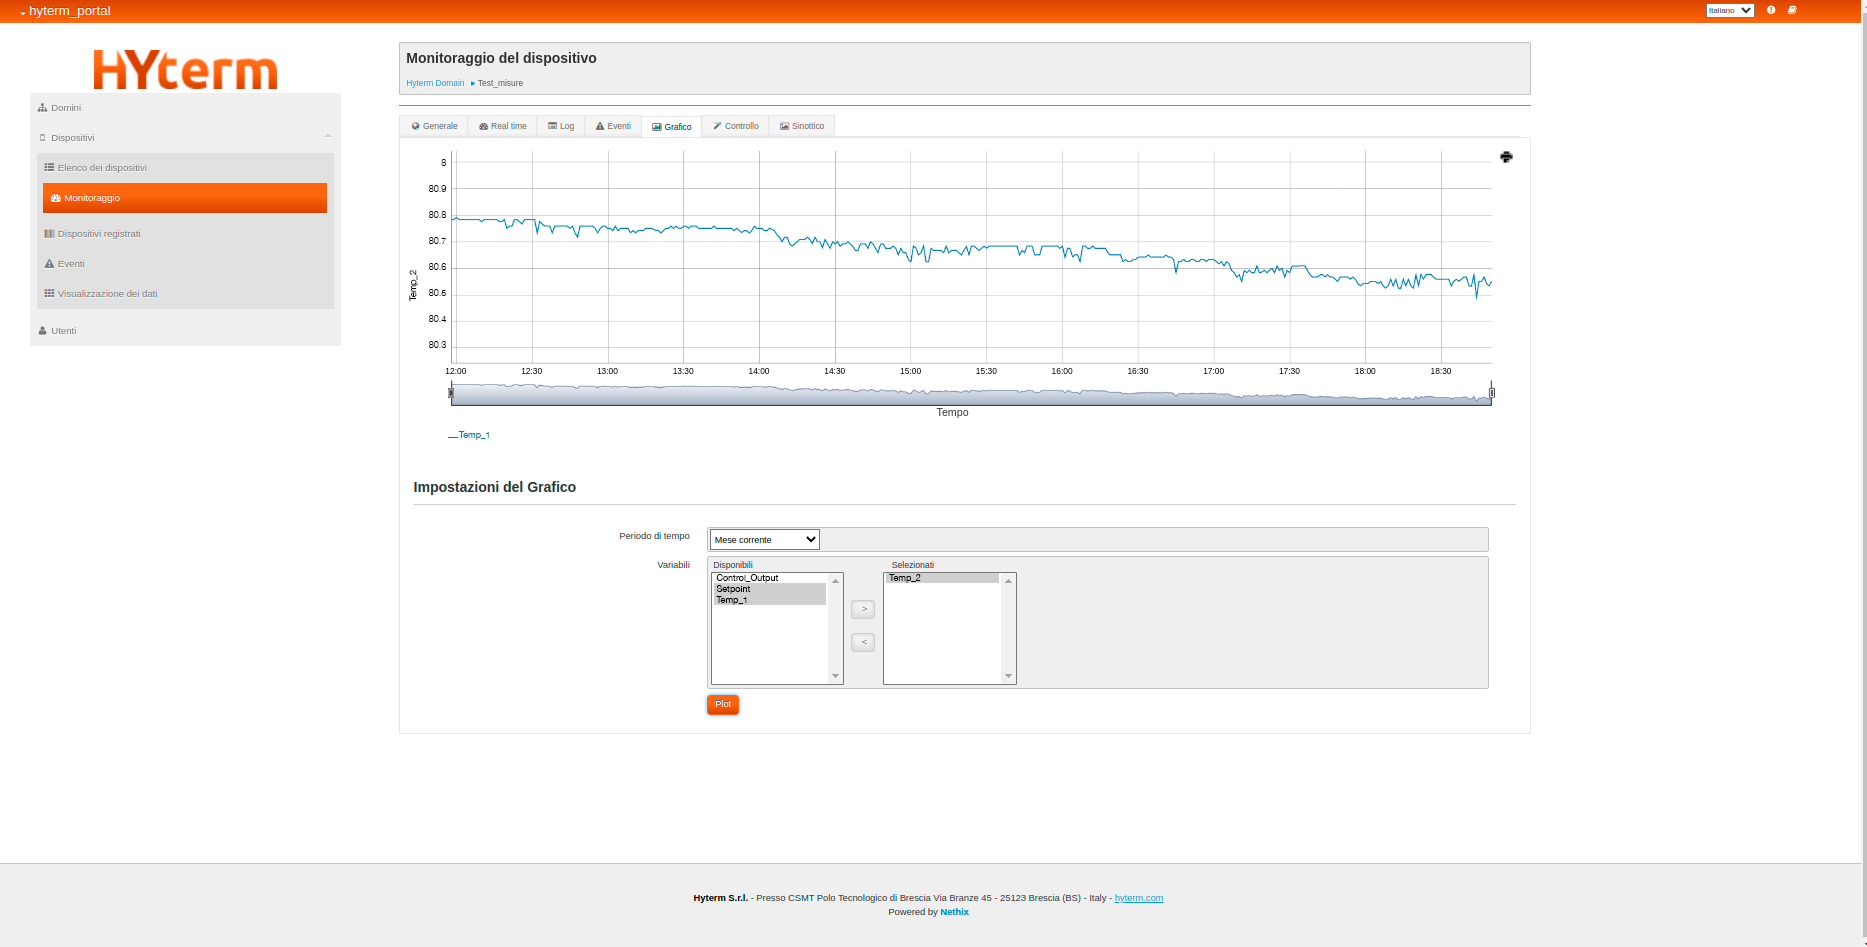
Web platform for remote monitoring

HyCloud is the service offered by Hyterm. It provides the remote control and monitoring of unattended of machines and plants.
Available through the web, it doesn’t require any installation and, thanks to a simple and intuitive user interface, allows to read data directly from a PC or mobile device.

Advanced Monitoring

HyCloud allows to have constantly under control machines or systems, even if instal-led in the most remote corners of the earth, avoiding costly on-site interventions.

Safe

The reliability of the HyCloud service is guaranteed by a dedicated VPN and secure communication channel, established according to standard encryption protocols.

Improvement of Performance

Thanks to the data collected, HyCloud allows an in-depth knowledge of machines and systems installed in the field, allowing them to be set-up in order to improve their efficiency.

Predictive Maintenance

HyCloud analyzes all collected data with the target of anticipating any machine or plant downtime with timely and punctual maintenance operations.

Data History

HyCloud displays the history of machines and systems in table or graphic form, using the acquired data.

Customizable

Developed in-house, HyCloud can be customized according to customer’s needs.

Flexible

HyCloud is compatible with all HYTERM products, but thanks to its flexibility it can be interfaced with any other device on the market. Its versatility makes it the ideal solution to be used on machines and systems already installed in the field.

HyCloud

HyCloud collects data and information from all devices deployed in the field and makes them available centrally by displaying them through complete and intuitive thematic pages.
Download hycloud brochure

General

GENERAL presents in a quick and simple layout all general data of the plant, as for instance the name, the geographical position, the type of installed gateway, the connection status and so on.

Synoptic

SYNOPTIC allows to have all main working parameters available at a glance: a simple and intuitive dashboard, available for the post-sales service, in order to give immediate and accurate answers.

Log

LOG shows all data in sortable columns: date and time of the sampling, variables, operating status and others, are available for download and post processing.

Graphic

GRAPHIC allows to display the variables trend over time directly on the cloud. The page allows to select one or more variables to be displayed, and the desired time interval, allowing a quick and reliable analysis.